


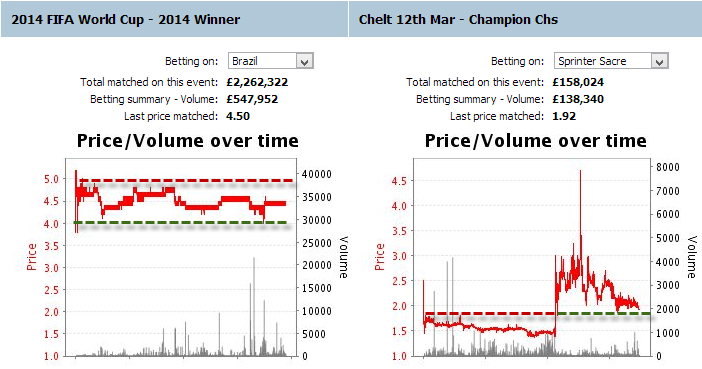
Technical analysis cannot be implemented on a betting graph without understanding first the concept of support and resistance levels. In sports trading, both the support and resistance levels are nothing more than horizontal lines. In the case of support, the betting odds are trading over the line, while in resistance the odds are found below the line.
In fact, the designation of these technical analysis’ lines reveals their function, as the support line indicates a price level which is well backed, while the resistance line shows a level which a further value increase meets resistance.
Usually both levels are examined at the same time when we analyze a chart, while there are quite a few trading strategies based to a large extent on support and resistance levels.
Drawing the support and resistance levels on betting graphs
Quite often, it takes no more than 2 value points shown in the chart, for drawing each horizontal line of support and resistance levels. A prerequisite of these two points, of course, is to indicate the same or nearly the same betting odds. If there is significant deviation, these points may be suitable for drawing a trendline instead.
When drawing the support and resistance levels, the lines must be extended to cover the betting graph both to the right of the right point – toward the future values of betting odds – and to the left of the left point, overlapping past values. [quote_box_right]Do not forget that the more support/resistance points the support/resistance line connects on the chart, the more credible indicator this line can be.[/quote_box_right] This is because an extension of the line to the right may confirm future forecast, while a span to the left can verify the support and resistance levels, when the line meets again support and resistance values of odds, which have been recorded in the past.
How to use support and resistance levels in sports trading
Support and resistance levels are primarily useful to decide on the direction of the trade and to fine-tune our entry point when trading in sports betting. If betting odds are approaching the support level, the trader should be preparing to place a lay bet, in order to benefit from the possible drift of odds, while a trader might want to back the selection when the resistance level is approaching.
Chances are that the betting odds would confirm again the support or resistance lines at the corresponding level, more likely than to break through. Thus the above trades are justified.
However, equally significant is the case when the odds indeed break either the support or resistance levels. Sometimes, the betting odds will return to confirm the previous level after the break-up, although this is not much of a rule. As a result, the support will become resistance and vice versa. I wrote yesterday of this breakout trading strategy at my finance blog, although in regards with stock trading. Still, the same principles apply.
When the price breaks the resistance or support level, this is considered perhaps even more important signal for the trader. Since the support or resistance level of the betting odds had been confirmed several times in the past, an odds movement lower or higher than these extreme levels was definitely unexpected. Therefore when it happens, it means that most traders or bettors believe that the price on these levels no more reflect the true or fair odds.
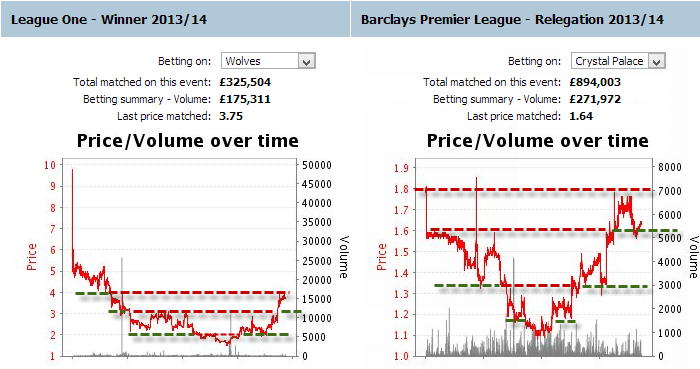
Consequently, although in the past they were placing their bets over and lower the support and resistance levels respectively, during a breakout they do not seem to react in the same way when the odds move beyond these levels. When a support or resistance level is broken, the support line becomes resistance level, while the resistance line (in red) becomes support (green) for the subsequent odds movement.
Support and resistance is just one of innumerous technical analysis’ tools
Despite the importance of support and resistance levels for a large number of betting systems, no trader could rely solely on these. They are very valuable tools of technical analysis, sure, but it is necessary to be combined with other indicators of technical analysis for the best possible results.
Still, there are hidden support and resistance levels such as pivot points, which we will refer to in the future.
[box type=”info”]Support and resistance levels do not indicate exact numbers rather than areas where we expect the odds to meet resistance or find support. So it may be better to refer to a level like 1.80-1.85 instead of simply 1.80.[/box]
Combining the support and resistance levels with the trendline is the first step a trader should make applying technical analysis in sports trading. Trading in and out near these price levels could make the difference between winning and losing in sports betting, and specifically in trading.


